How to Create a GeoChart with OpenInsight for Web
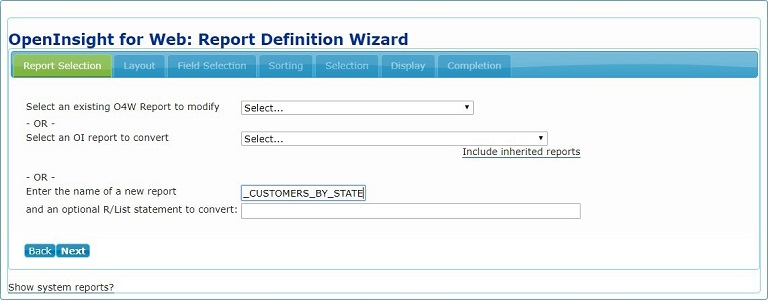
1. An effective way to create a graph using O4W is to start with a report. In the following example we will create a GeoChart graph showing the numbers of customers by state. By creating a simple detail suppressed report of customers by state we can easily convert the report into a graph using the O4W Dashboard wizard. In this step we have opened the Report Definition wizard a will create a new report called EXAMPLE_CUSTOMERS_BY_STATE.
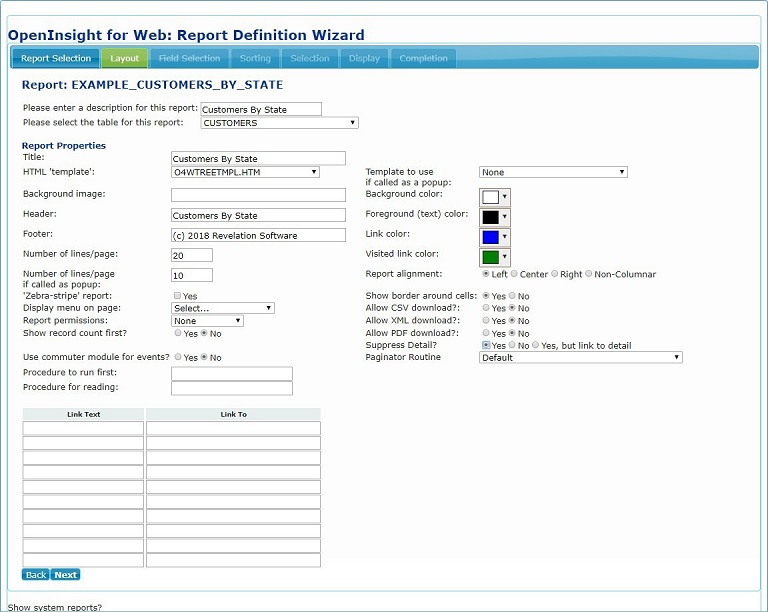
2. In the Layout tab, make sure that this report is marked Yes for Suppress Detail.
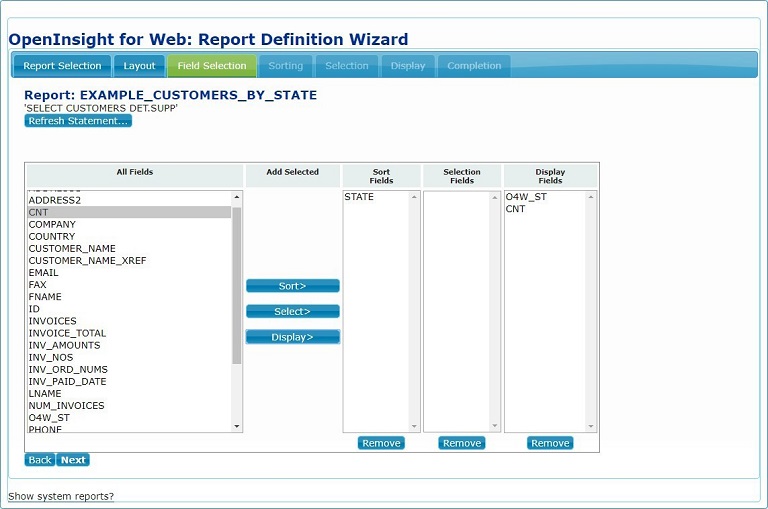
3. In the Field Selection tab we will sort on the STATE dictionary and display the
O4W_ST and CNT dictionaries.
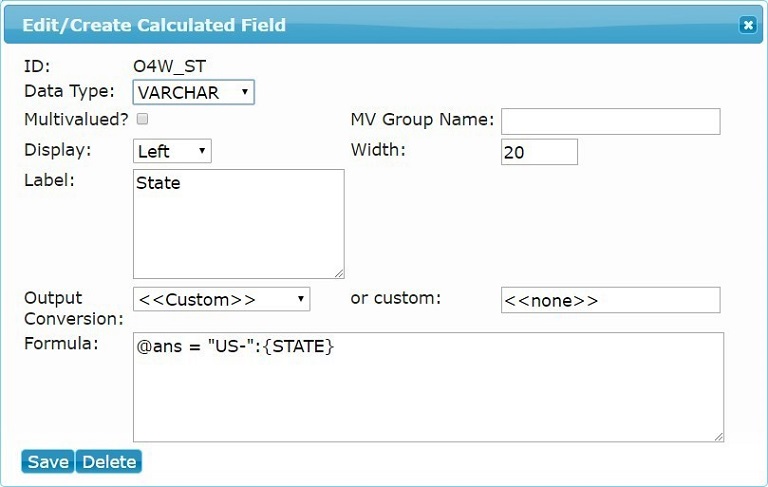
4. Note that the dictionary O4W_ST is a calculated column. It is essential that the formula for the dictionary is as follows: @ans = "US-":{STATE}
This field will be utilized for the X data source of our graph.
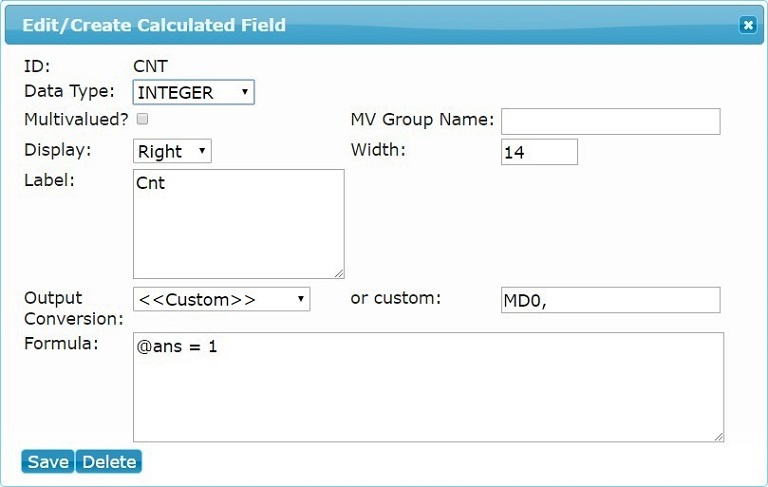
5. Note that the dictionary CNT is a calculated column with a formula: @ans = 1
This field will be utilized for the Y data source of our graph.
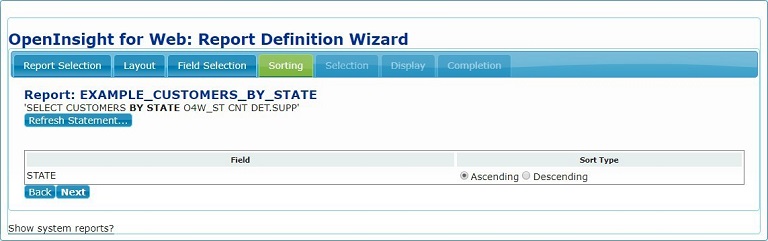
6. In the Sorting tab we will provide an Ascending sort type on STATE.
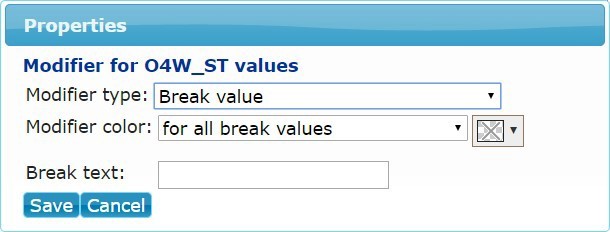
7. In the Display tab we will set the Value Modifier for each field.
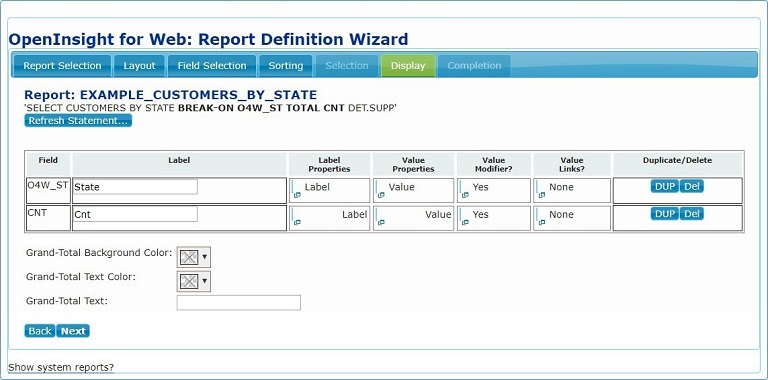
8. The Modifier type will be set to Break value on the O4W_ST field.
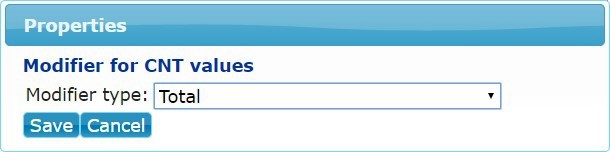
9. The Modifier type will be set to Total on the CNT field.
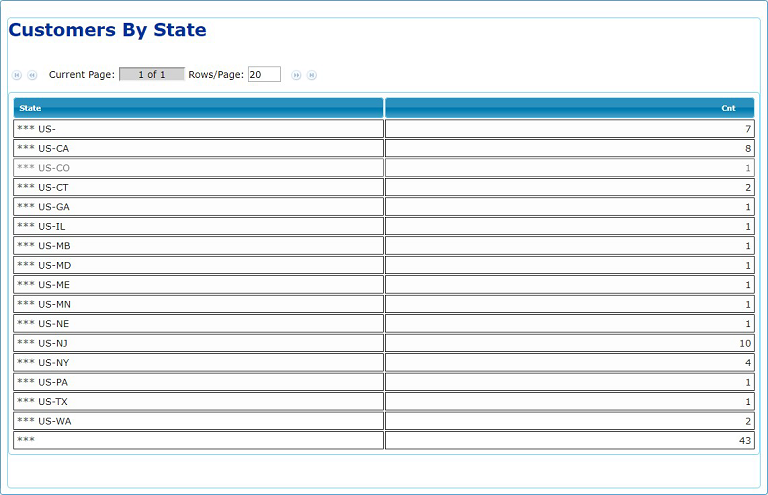
10. If we run this report, the output created is a detailed suppressed report that breaks on O4W_ST with totals for each State. The State column will be utilized for the X axis of our graph and the CNT column will be utilized for the Y axis of our graph.
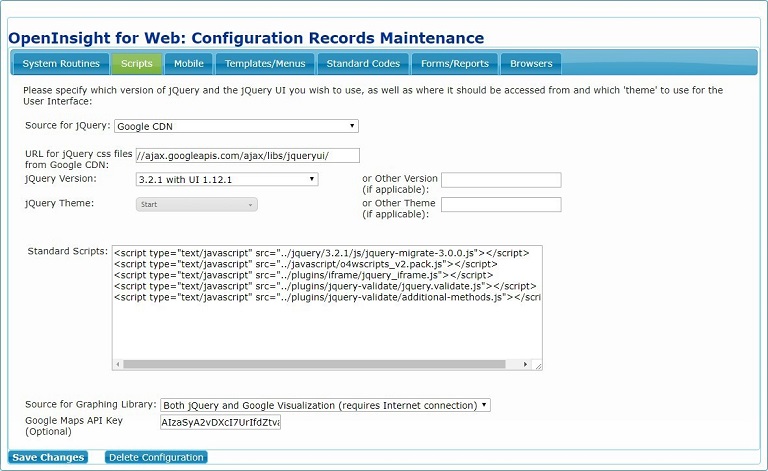
11. Prior to creating our O4W Dashboard to output a GeoChart we must create a Google Maps API Key and add it to the O4W Configuration Records Maintenace Screen on the Scripts tab. Instructions to create a Google Maps API Key can be found at:
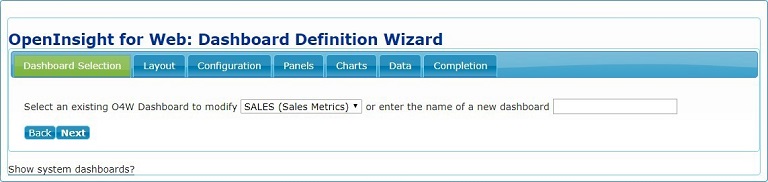
12. In this step will utilize the Dashboard Definition Wizard to create and O4W Dashboard.

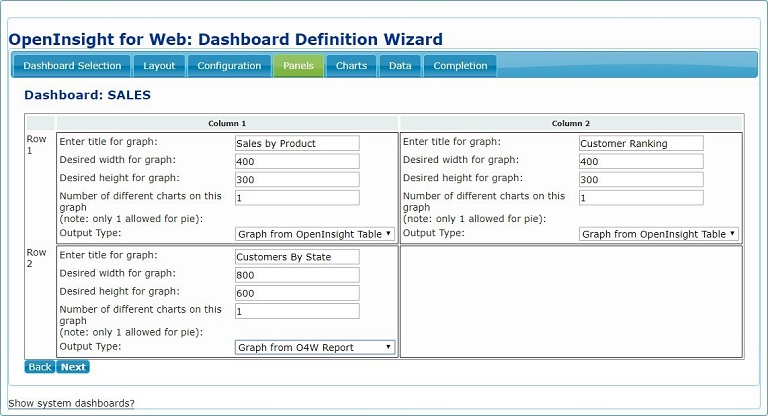
13. In the Panels tab we will define our graph. Make sure that the Output Type is set to: Graph from O4W Report.
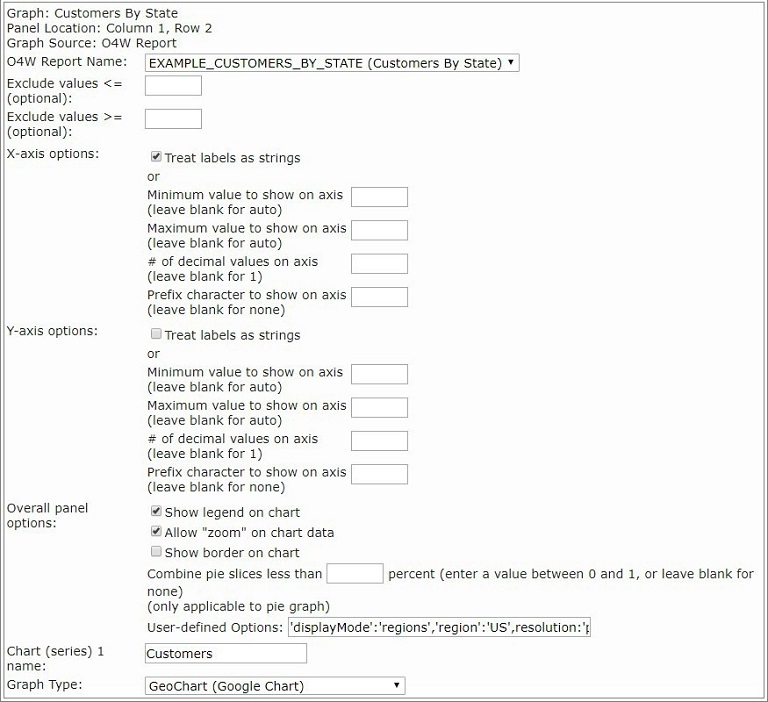
14. In the Charts tab we will select our O4W Report Name: EXAMPLE_CUSTOMERS_BY_STATE
The X-axis options should be set to: Treat labels as strings
The User-defined Options must contain the following: 'displayMode':'regions','region':'US',resolution:'provinces'
The Graph Type must be set to: GeoChart (Google Chart)
In order to select a Google Chart you must have Google Visualization selected as the source for graphing library on the Scripts tab for O4W Configuration Records Maintenance.
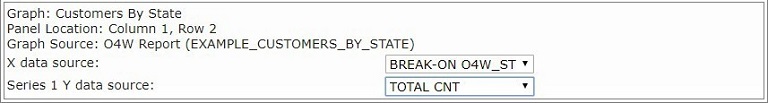
15. In the Data tab make sure that X data source is set to: BREAK-ON O4W_ST and the Y data source is set to: TOTAL CNT
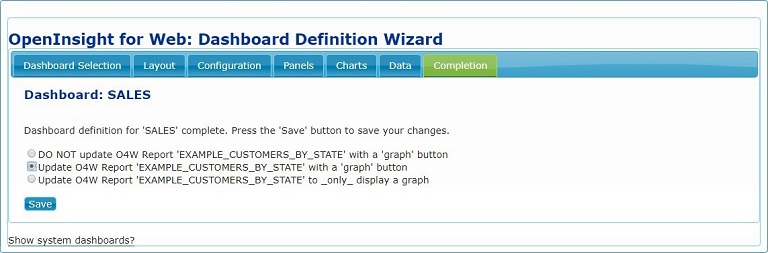
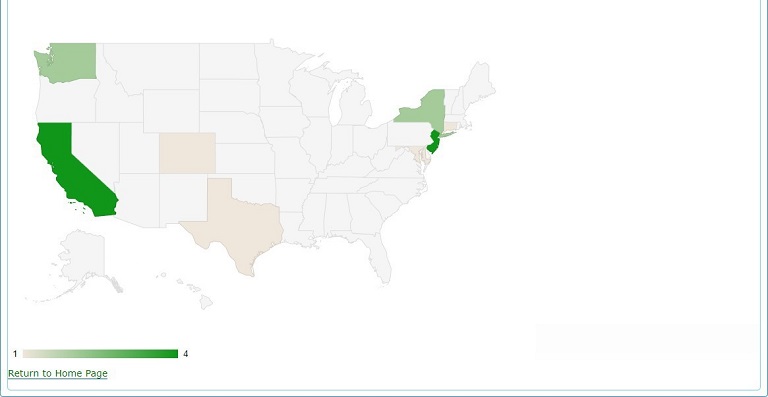
16. Running the Dashboard will produce a GeoChart of the EXAMPLE_CUSTOMERS_BY_STATE report.